Cats vs. Everything Else — A Binary Classification Problem
Pre-word — This article is fairly technical, so bear with me 😆, but I’ll try to keep it simple as possible.
Human intelligence is a multifaceted and dynamic cognitive faculty, encompassing diverse capacities such as problem-solving, creativity, emotional understanding, and adaptability, allowing individuals to navigate complex challenges and thrive in varied environments. — ChatGPT 3.5
Basically, humans are an intelligent species. Why? Well, it's because we can divide everything into, Cats and Non-Cats. Let’s talk about cats 🐈

If I ask you if this is a picture of a cat, you’d probably say yes unless you think this is a mango. Anyway, the answer is a Yes or a No. This is known as a “Binary Classification Problem” — I know, pretty big words for such a simple question. But how do computers say whether this is cat picture or not.
To us an image is a set of colors arranged in a very specific way. To a computer an image is basically 3 matrices of equal dimensions(say n x m). To be more specific — An image is stored in the computer in three separate matrices corresponding to the Red, Green, and Blue color channels of the image.
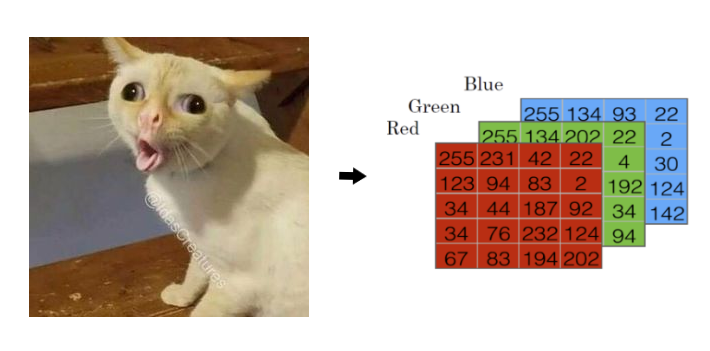
For simplicity we don’t have to worry about what those numbers mean, but just keep in mind that to a computer, an image is a set of numbers arranged in a very specify way.
Infact we can reshape the above 3 matrices into the form of one single vector of dimension (n x m x 3, 1).
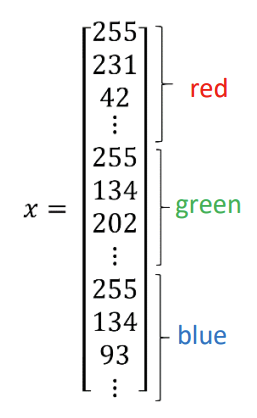
We call this a “feature vector”. In the case of the image, every single dot(pixel) represented by 3 numbers (RGB values), comprises of 3 feature points — the red, green, blue values. Hence the feature vector of an image contains (number of pixels x 3) many feature points.
Ok, now what do we do with this? 🤔
Introducing — Logistic Regression
Logistic regression is a learning algorithm used in a supervised learning problem when the output 𝑦 are all either zero or one.

Basically, we can use logistic regression to solve a problem when the answer is either a Yes or a No. In our case, we can use logistic regression to solve the problem of whether an image is a cat or not.
But how does it exactly work? 🤔
What we want is a prediction whether the image is of a cat or not. In other words the computer will give us a probability of an image being of a cat given an image. We can formally write it as,

where y is the output and x is the input feature vector of the image.
How do we get this probability — the prediction? Well, we have our feature vector, which is basically a list of numbers. We can multiply each of these numbers by a weight and add them up. Weights? Well, not all feature points are equally important. For example, the color of the sky area in the picture is not as important as the color of the cat. So, we can assign a weight to each feature point.

This can be written in a more compact form as:

where w is a vector of weights and x is the feature vector. (This is where your knowledge of vectors and matrices come in handy 😉)
We can then add a bias to this value. This is basically a number that we add to the sum of the weighted feature points. This is done to make sure that the output is not always 0. We call this the linear model.

But we can’t just add up all the numbers and get the answer. This is where a sigmoid function (σ) comes in. For example, we can take the logistic function,

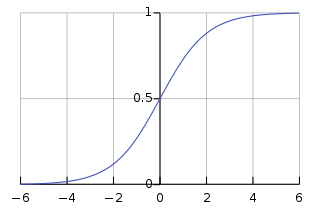
This function basically squishes the output of the linear model between 0 and 1 (remember that probabilities lie between 0 and 1? 🙂). We can pass the sum of the weighted feature points and the bias through the sigmoid function to get the final output — the prediction (the probability that the given image is a cat).

If the prediction(ŷ) is greater than 0.5, we can say that the image is a cat, else we can say that it is not a cat (0.5 would be a general case — you can choose this value on your own).
Again, when a feature vector of an image x is sent through a linear model (the z equation) and taken as input for a sigmoid function, we get the probability that given image is a cat😺
But wait a minute, how do we know what values to use for the weights and bias? That’s where logistic regression and machine learning actually comes into play 😄 and that’s a topic for another article 😁
Comments
Post a Comment